IC for Geological Evaluation
Generate high quality, up-to-date well and regional reviews and maps quickly. Display all relevant data down-hole and build consistent reviews from well to well to summarize the detail at any scale. Grid parameters on the map to show regional and local trends easily using complex and flexible gridding algorithms.
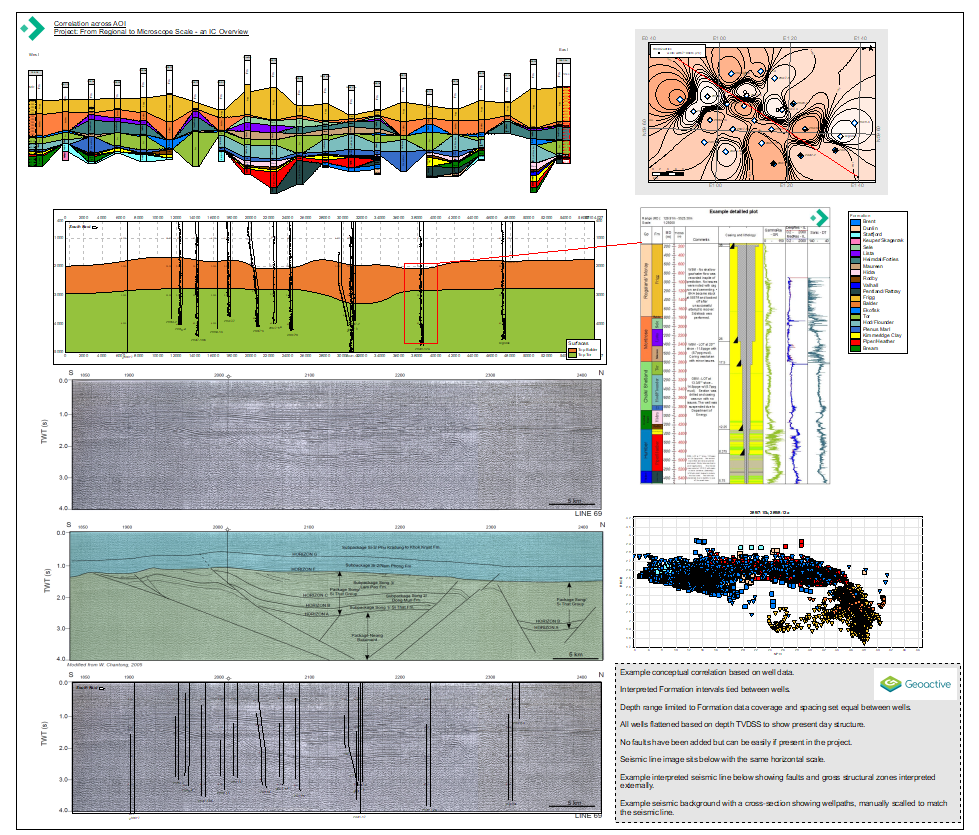
Build correlations or single well summaries directly from a map to show specific zones to understand the lateral as well as vertical variations in the geology reducing the unknown and risk factors in your interpretations.
Download The Flyer


Louise Banks
Support Geoscientist
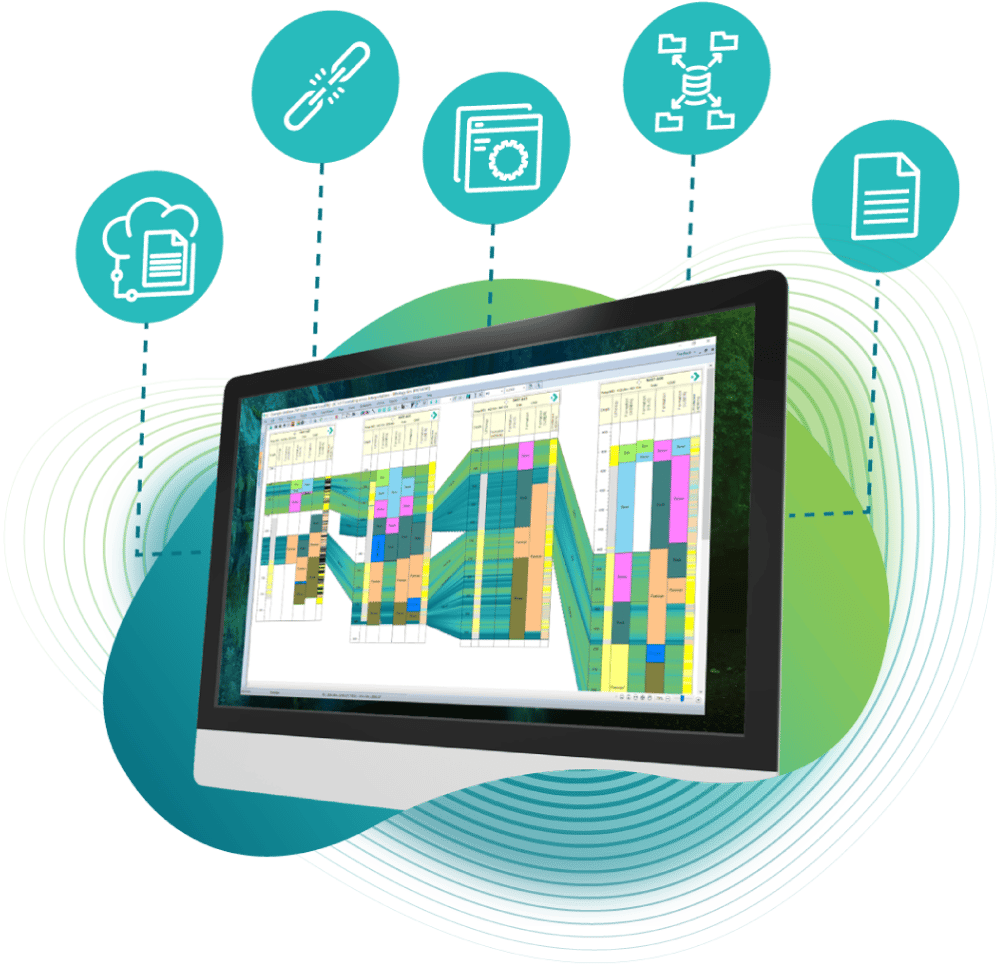
“Turbo-charge you asset presentation with the IC Geology module. This powerful set of tools provides 2D geological displays, robust mapping features, interactive charting and visualization. Use templates to quickly build standardized well correlations and cross sections from maps and integrate surface grids well path data and interpretation data in the 3D Viewer.”
IC allows you to analyse, visualise and communicate your understanding of the subsurface across your teams effectively. Reservoir mapping, single or multi-well summaries and correlations on our dynamic and interactive charting workspace help you spot significant patterns, trends and anomalies quickly.
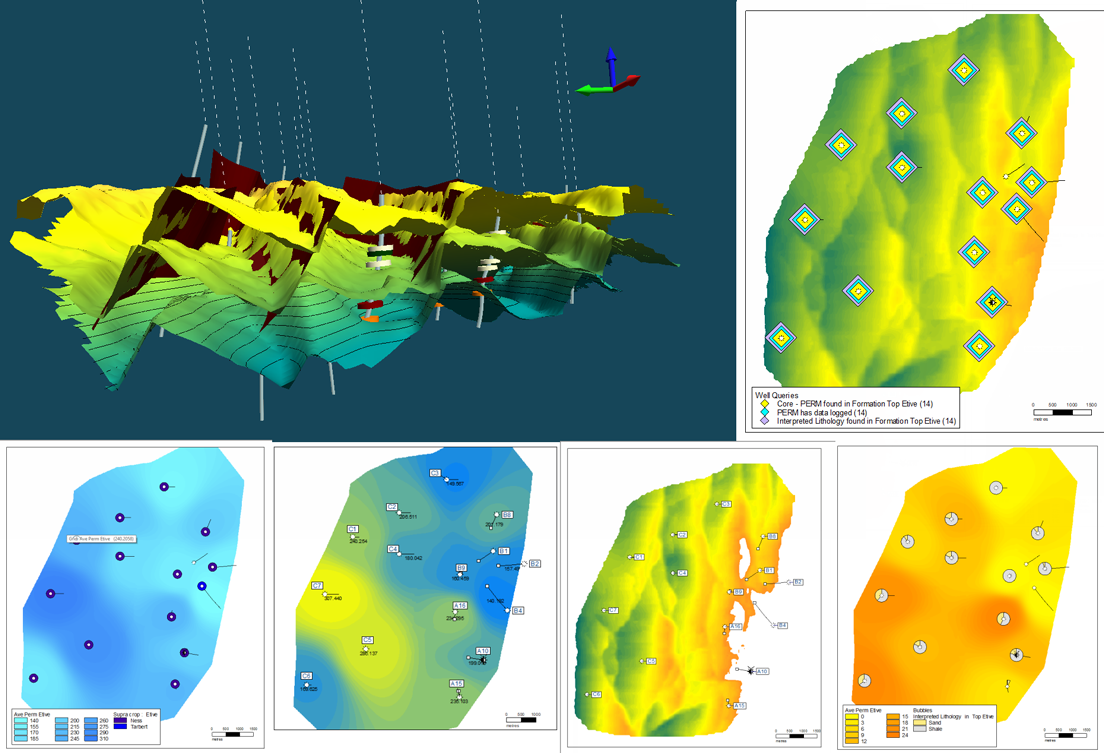
Integrating GIS, you can quickly understand the spatial distribution of any well data and identify any anomalies across a dataset:
- Employ powerful well queries to highlight missing data
- Dig deeper into your subsurface view while maintaining lateral visualisation
- Create inter-well view of your subsurface data
- Maps link to live data for automatic updates
- Interactive 3D views incorporate faults, grids and wellpaths directly from maps
Pictured: Utilise gridding, zonal analysis, seismic interpretation and queries to review and identify structural variations across the region in both 2D and 3D environments.
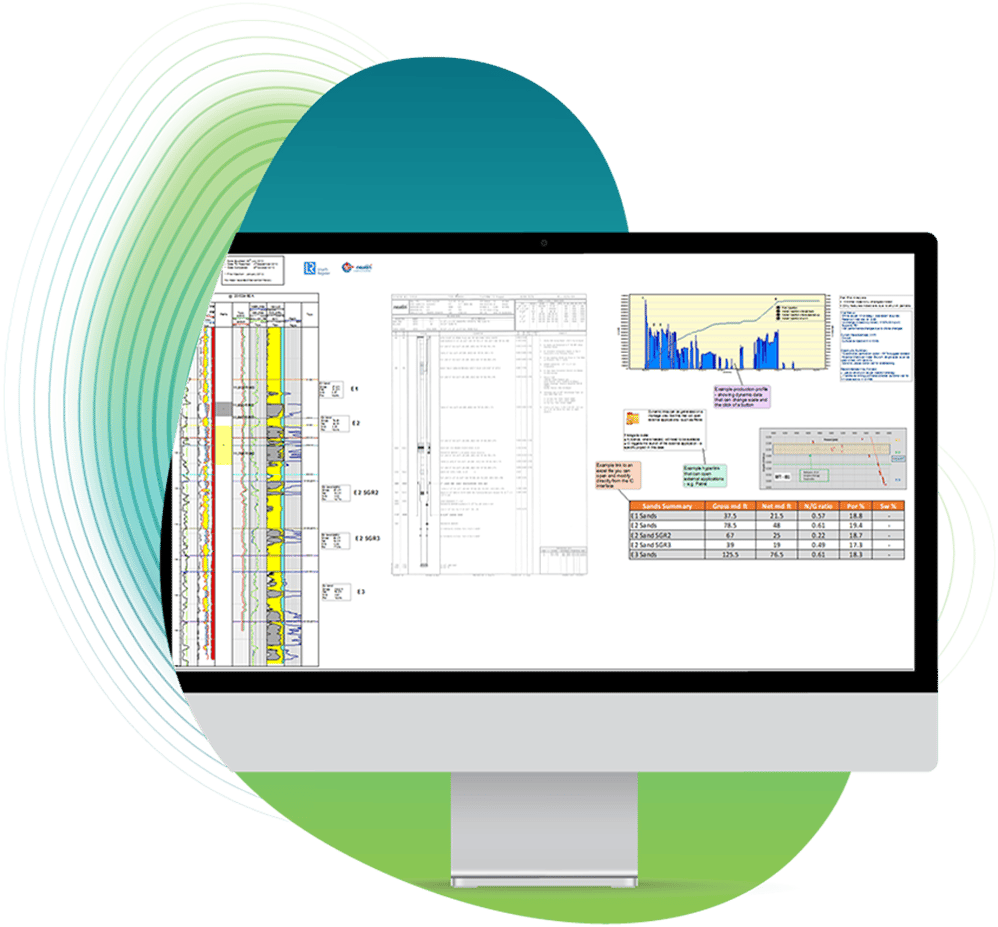
IC lets you produce detailed single- and multi-well summaries that integrate wellstick displays with analytical plots. Add maps and cross plots to charts to build complex montages. Standardised templates support accurate comparisons and rapid production of multiple reviews in a fraction of the time it took previously.
- Combine maps and multi-well displays like correlations or cross-sections to build powerful field or basin reviews
- Easily and rapidly share intelligence with charts, screenshots and PDFs
- Add text directly to help explain your findings and share with your team
IC’s sophisticated mapping and reporting and intelligent automation toolkits can help deliver powerful reviews. These result, in close collaboration with your team, can lead to confident decisions being made more often, providing input across a range of projects across the energy industry.
Pictured: Regional summary integrating multi-well correlations, crossplots, map analysis and cross-sections alongside more detailed data summaries for a single well and seismic line images.

Toolkits