IC for Monitoring
Increase the range and understanding of your subsurface data by including historical, time-stamped, elements.
Regardless of purpose, your subsurface evaluation and future projects can be reconfirmed and reviewed with a time element beyond just the geological scale.
By introducing historical data from your actively producing field; your CSS site or even brownfield sites to your geological understanding of your subsurface, you can produce graphic evidence to confirm your decisions easily.
Download The Flyer

Alex Kaye
Global Customer Support Manager
“Utilise IC Monitoring to build a dynamic model of your field, allowing you to fully integrate historic datasets with a time-element, enabling you to visualise variations spatially across the field over time both spatially and in depth using the 3D viewer.”
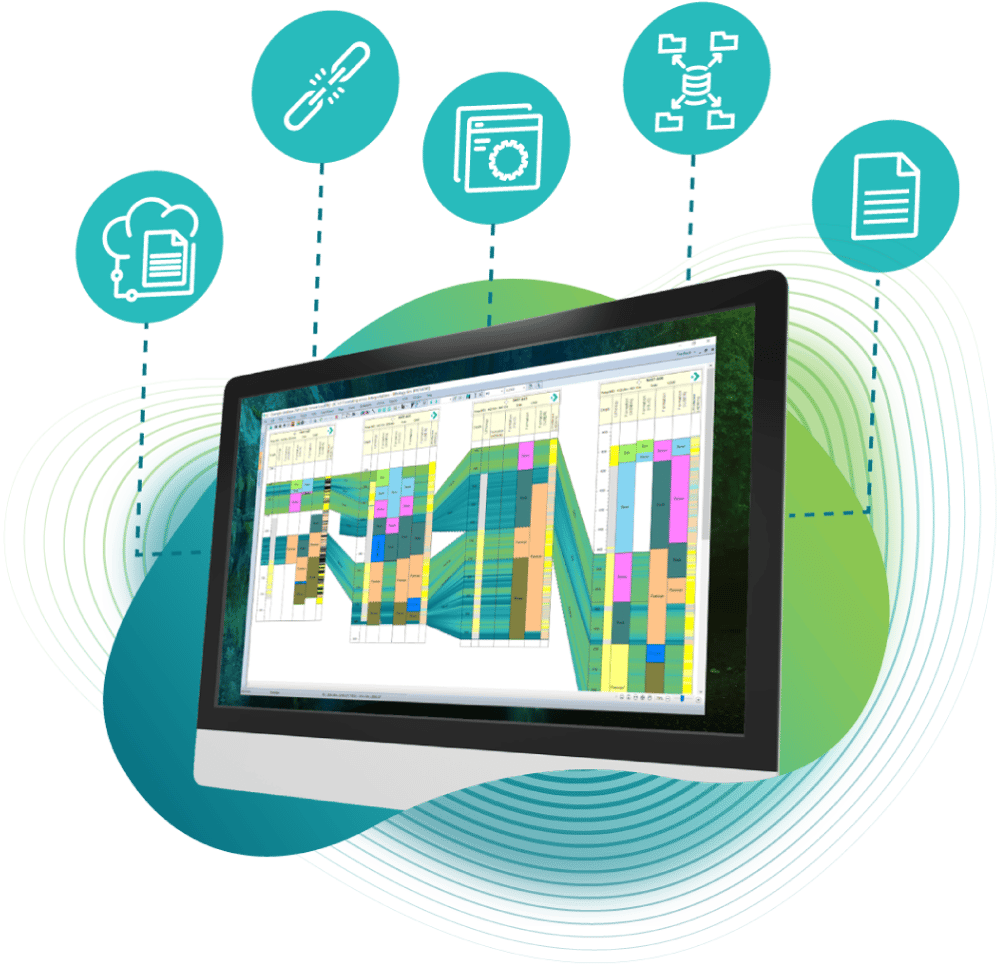
The provision of a production monitoring and visualisation toolkit (RPM) expands IC's capabilities, bringing in historical data to cover your whole asset lifecycle.
- Synchronise your IC database to external data stores to pull in regularly updated values
- Build a series of automated scripts to improve your data gathering and analysis of raw data
- Generate and save reports for time-based data to share alongside production profiles or graphs
Pictured: Flexible display styles of date-based drilling, production, injection and economic data as profiles, tables and well plots integrate to show.
RPM was originally designed to provide production and field development teams with the resources needed to build and display well data as they wish to improve the understanding and identification of anomalies across their field or basin.
- Display dynamic queries to step through your well history directly on your map
- Visualise dynamic inter-well variations across fields over time using grids in 2D or plots in 3D
- Synchronise maps with production databases to automatically update views
- Generate single-well and basin-wide summaries using standardised displays format and plot styles
- Include date-qualified temperature or pressure logs to show the changes downhole for each wells
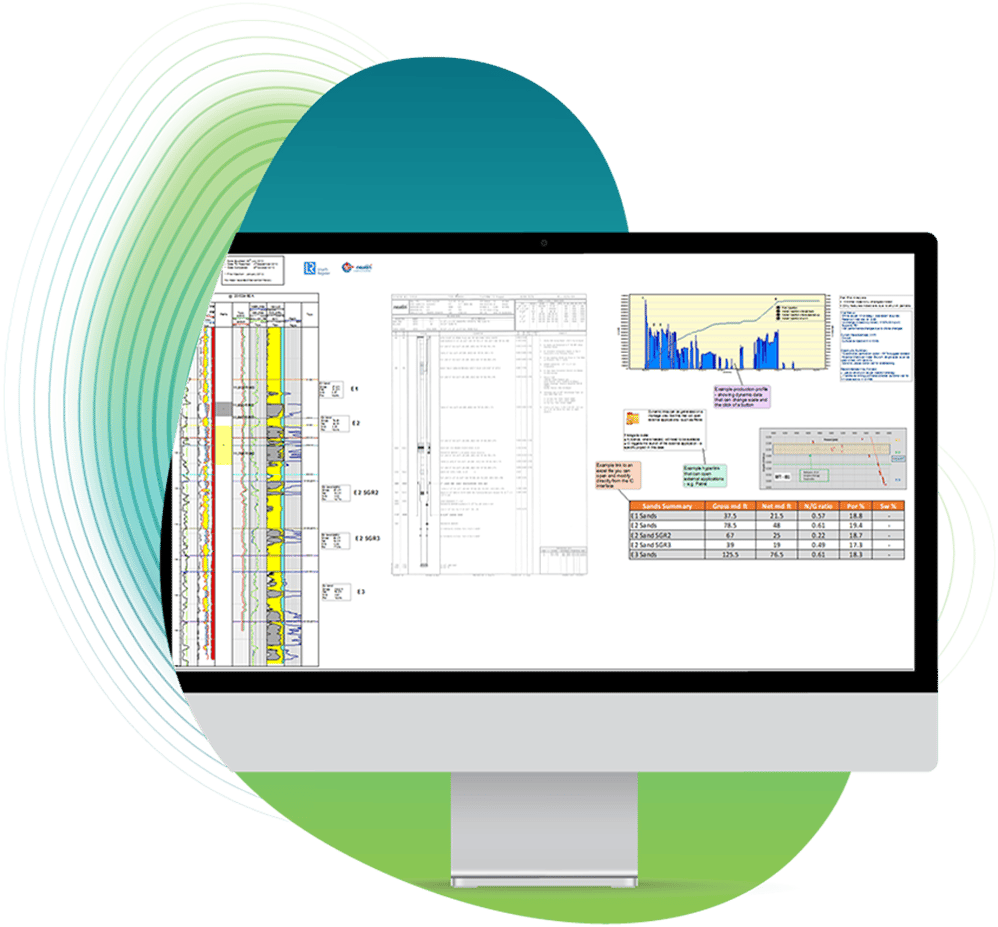
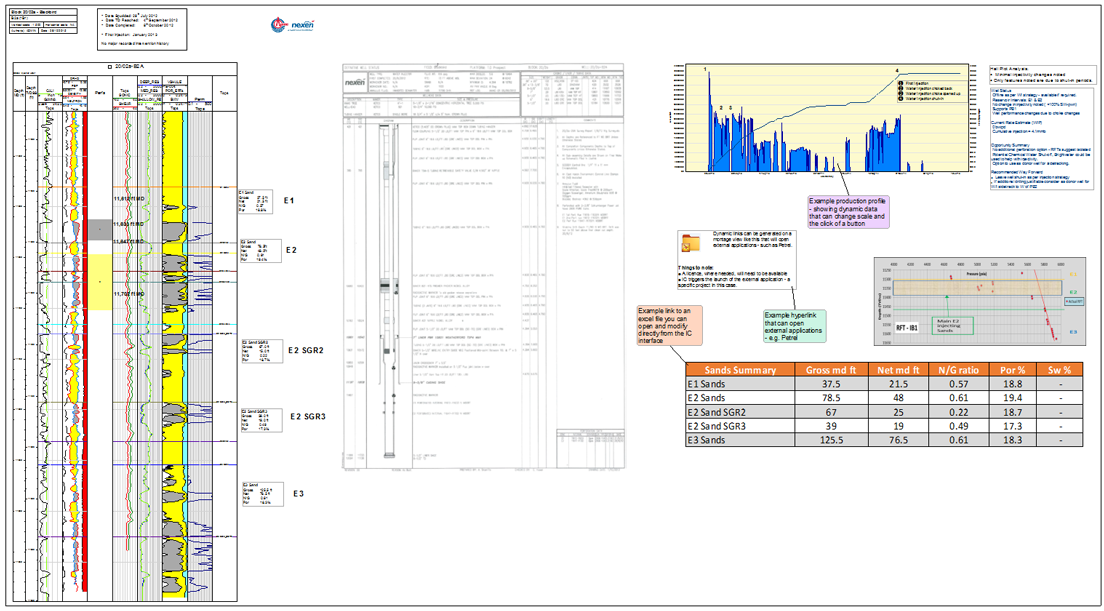
The addition of time-stamped data provides you with the tools to view and understand the history of your field easily. Assess well performance history and investigate the geological reasons behind changes in production, water cut or pressure. It makes it possible to identify potential risk for reduced performance and make swift decisions on how to alter the current routine and save days of downtime and confirm any change with confident application of measured data.
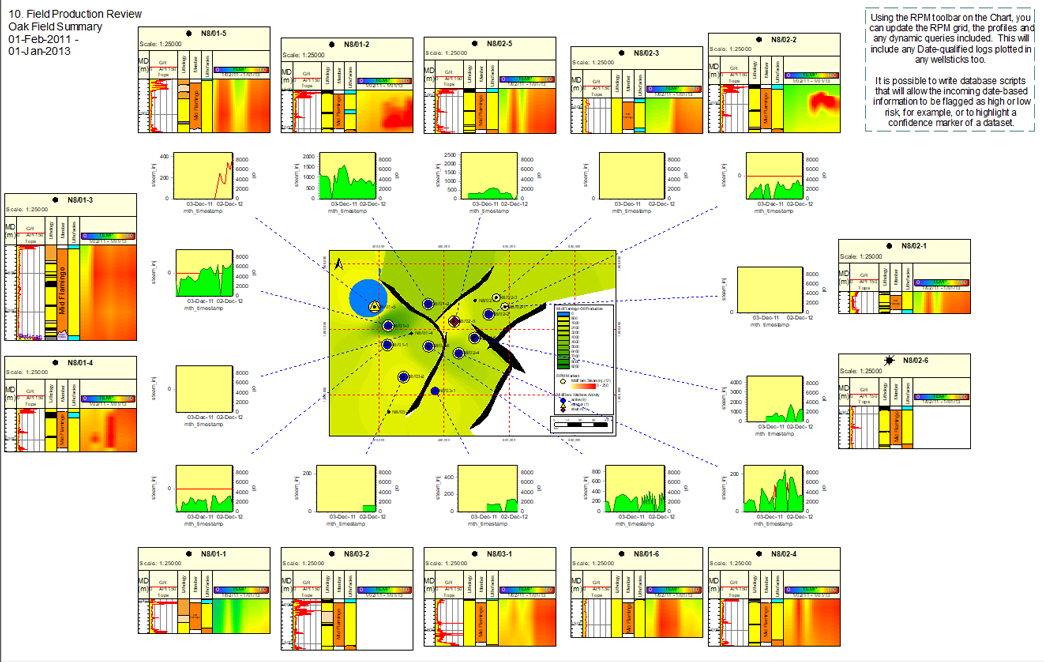
Pictured: Integrating production grids, dynamic queries, well plots showing date-qualified temperature logs and production profiles can give a more holistic view of your field for regular summary reviews.

Toolkits